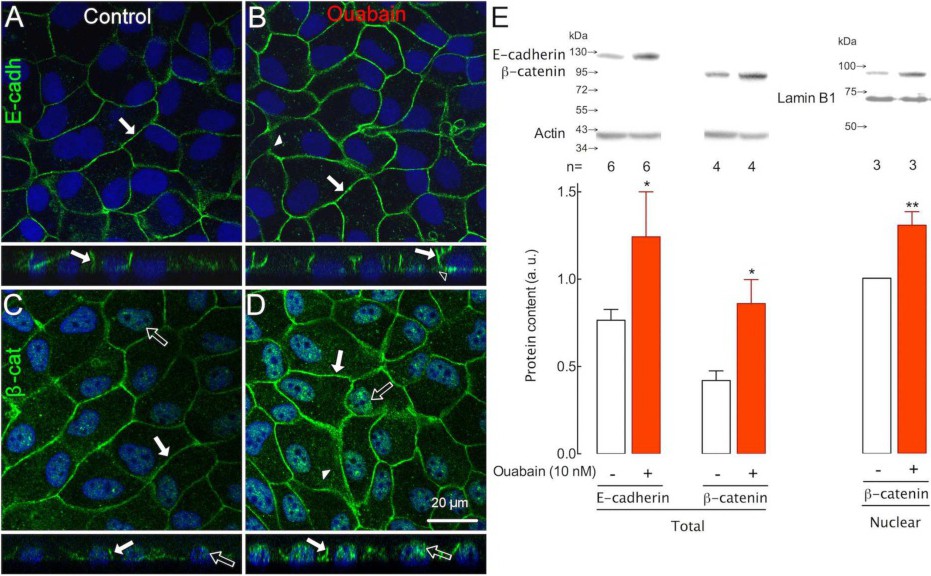
Fig. 1. Ouabain increases the expression of specific adherens junction proteins. Immunofluorescence of E-cadherin (E-cadh, A and B, green) or β-catenin (β-cat, C and D, green) in confluent monolayers of MDCK cells under control (A and C) and 10 nM ouabain (B and D) conditions. Nuclei are stained in blue. Cell monolayers are observed in fluorescence images of single optical slices in the x-y (upper) and x-z (lower) orientations. In control cell monolayers, E-cadherin (A) and β-catenin (C) are distributed mainly in the periphery (white arrows). Eight hours of exposure to ouabain increased the amount of E-cadherin (B) and β-catenin (D) at the cell border and displaced β-catenin towards the nucleus (D, empty arrows). Ouabain induced the appearance of several basal locations of E-cadherin (empty arrowhead). Western blotting (E, above) and densitometric analysis (E, graph) of cellular or nuclear protein extracts normalized to actin or lamin B1 (E, above), respectively, showing the normal amount of both proteins (white bars) and the increased amount of proteins produced by ouabain (red bars) in cellular and nuclear extracts. * P<0.05, n= 6-3, ** P<0.01, n= 6-3, t-test.